
PORTLAND, Ore. — As a global pandemic like the coronavirus spreads, health officials around the world worry about hospitals being overwhelmed with patients needing intensive care, therefore increasing mortality rates and spreading the virus to a much larger population.
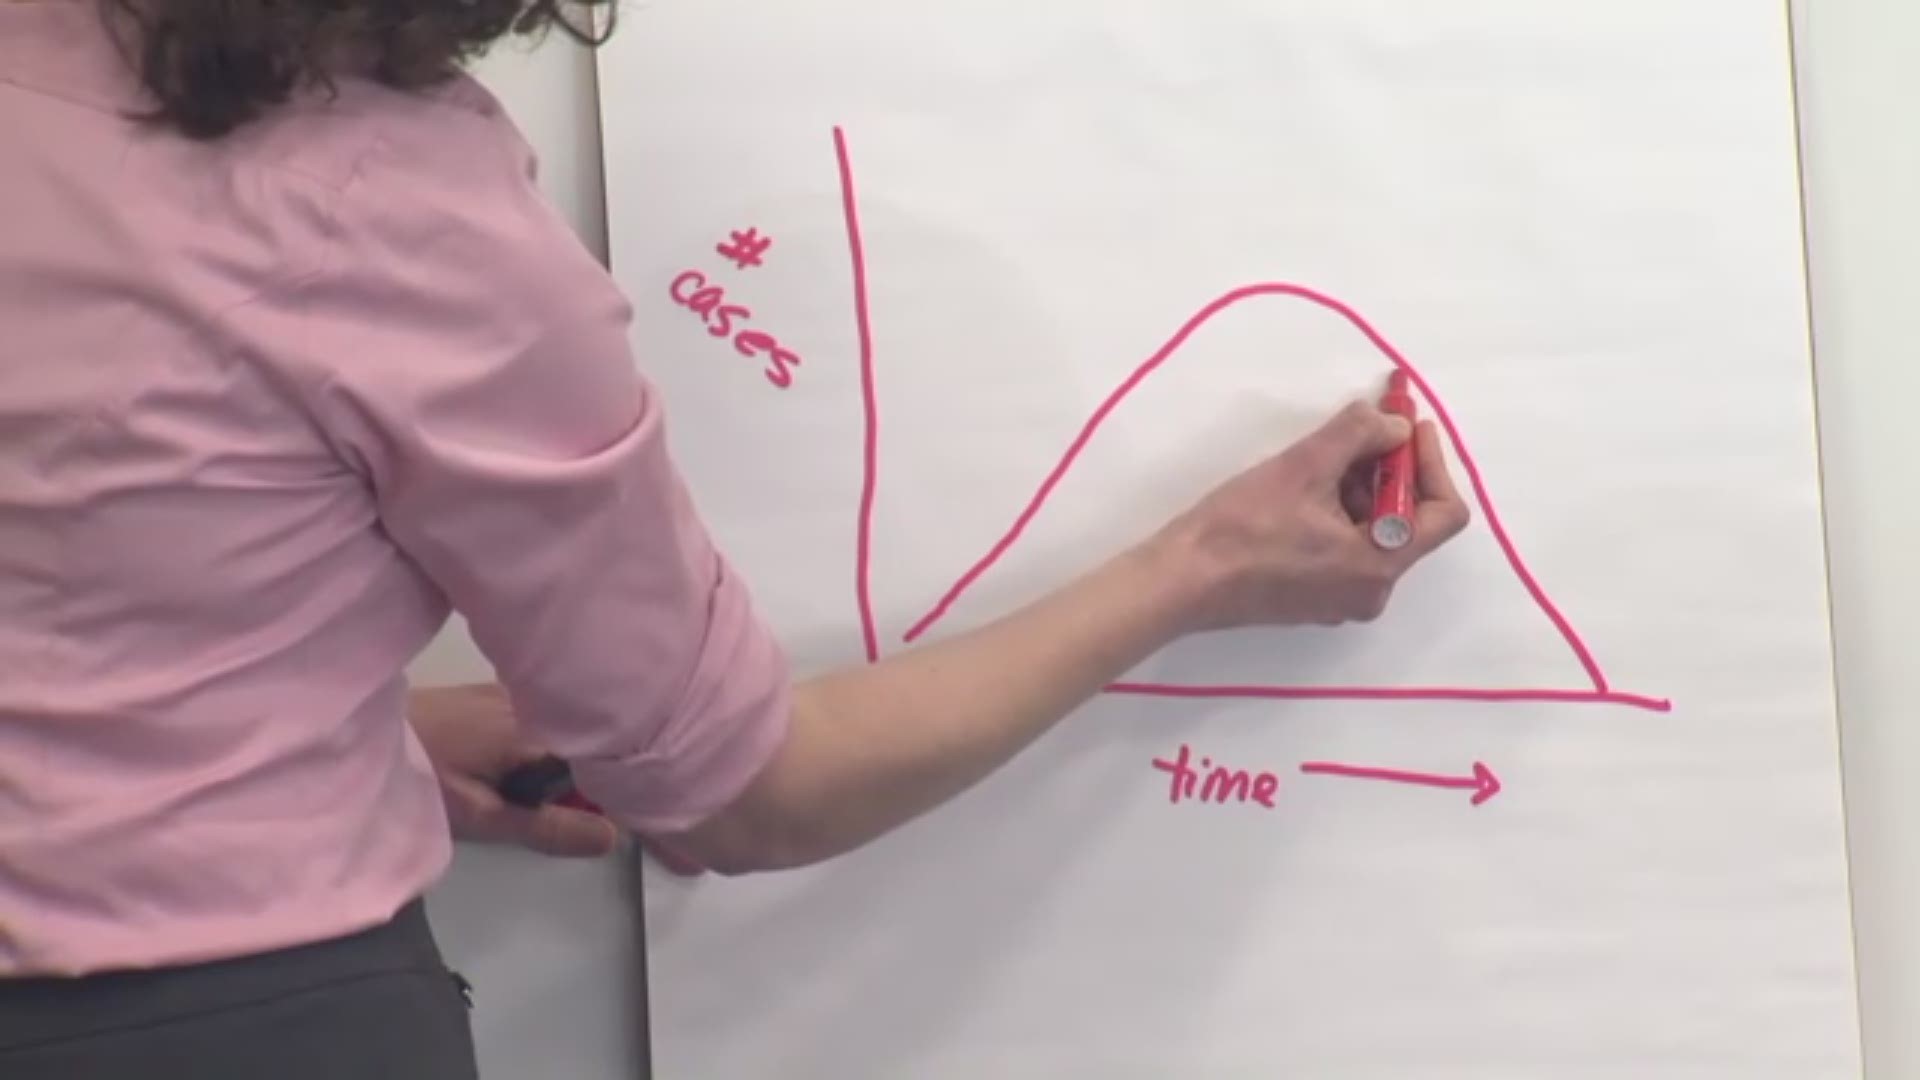
Different versions of a chart called the "flattened curve" have been shown by experts in Oregon -- and worldwide -- to help illustrate what kind of burden an overwhelmed hospital system could have.
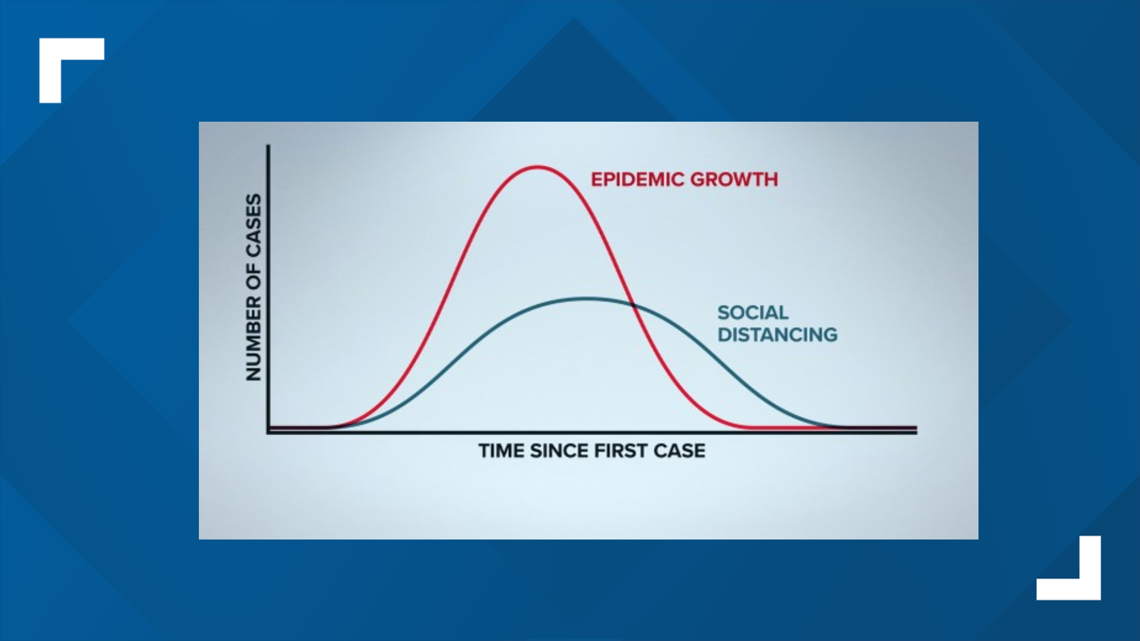
It shows two curves -- the red "epidemic growth" line represents a heightened number of cases over a short amount of time.
This occurs in an environment where no social interventions have been placed. For example, if the population is simply going about their usual daily business, the virus is likely to infect more people in a shorter amount of time. (See CDC's explanation)

"The top of that peak is are people who need intensive care or ventilators. We want to flatten that peak and spread cases over time, so when the most critically ill get sick, they get access to resources and get a better shot at recovering from the virus," Jennifer Vines, Multnomah County's health officer, explained this week.
The second line shows the number of cases with social distancing implemented during the early stages of the virus. This slows the growth of the epidemic, and puts a lot less stress on the healthcare system, therefore lowering the mortality rate.
A good example of what social distancing can do to an epidemic's growth is what two American cities chose to do during the 1918 during the influenza pandemic. Philadelphia went on with holding large, social gatherings while the city of St. Louis canceled those kinds of events:

